Quantitative Evaluation of Avatar Accuracy
This project marks a huge step forward for Copresence and the mobile scanning industry for 3D in general. For the first time, we have a tool that allows us to quantitatively assess the accuracy of our avatar reconstruction pipeline. In a field where visual fidelity is critical, having measurable quality metrics is a game changer.
✅ This is the first time a tool quantitatively measures avatar accuracy in mobile 3D scanning.
Until now, the validation of avatars has been largely subjective based on visual inspection or indirect performance metrics. With this tool, we can directly measure how closely a generated avatar matches the original scanned data. This not only helps us identify weak spots in the pipeline but also gives us a reliable way to track improvements over time.
🛠 Provides objective data to identify pipeline weaknesses and track improvement over time.
This is more than a debugging utility, it’s a quality assurance framework that ensures our digital humans are not just lifelike, but provably accurate. It raises the bar for realism and helps build trust in the technology, both internally and for external stakeholders.
To accurately evaluate the quality of our avatars, we must compare them against real human subjects. This begins with capturing a high-fidelity ground truth of each person using the Copresence capture studio. Our studio employs a synchronized multi-camera setup (Fig. 1) to acquire depth and RGB data from multiple viewpoints, which we then fuse into a detailed 3D point cloud and mesh of the subject.
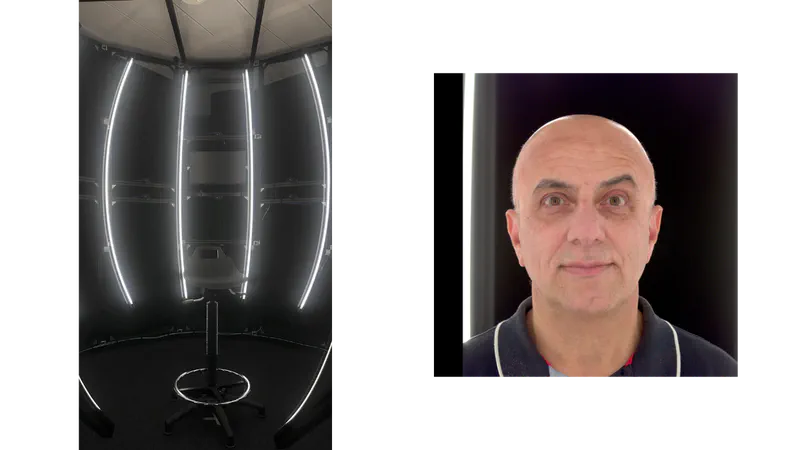
Next, the same individual records themselves using the Copresence mobile app, which generates an avatar via our standard reconstruction pipeline. We align this avatar with the studio scan and overlay them in 3D space (Fig. 2), allowing for an immediate visual and geometric comparison.
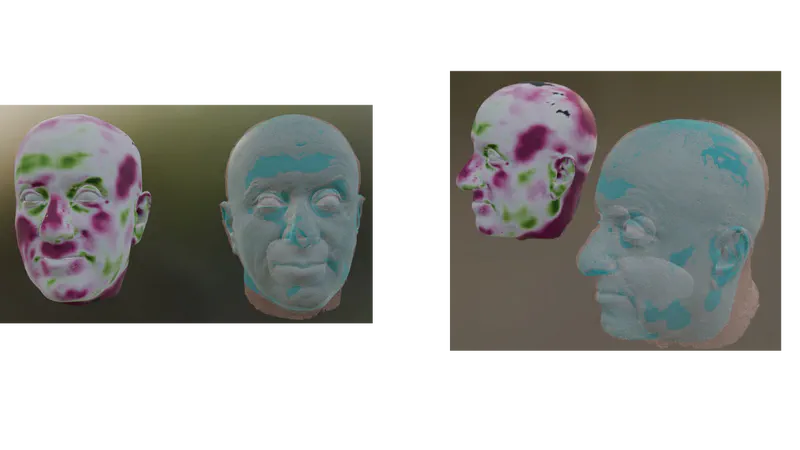
This qualitative view provides an intuitive first look at how closely the avatar matches reality, but it sets the stage for quantitative analysis in the following steps: To truly assess quality, we developed a quantitative evaluation method that delivers spatially resolved measurements of geometric accuracy. We compute the signed distance between the avatar mesh and the ground truth mesh reconstructed from the studio data. Instead of relying on simplistic vertex-to-vertex metrics, we use a collision-aware surface distance algorithm that evaluates every point on the avatar against the entire surface of the ground truth mesh.
🧪 Collision-aware surface distance method captures detailed surface deviations like over-projections and undercuts.
This method captures fine-grained discrepancies, including over-projections, undercuts, and subtle surface deviations, offering a much more comprehensive and precise assessment of reconstruction fidelity.
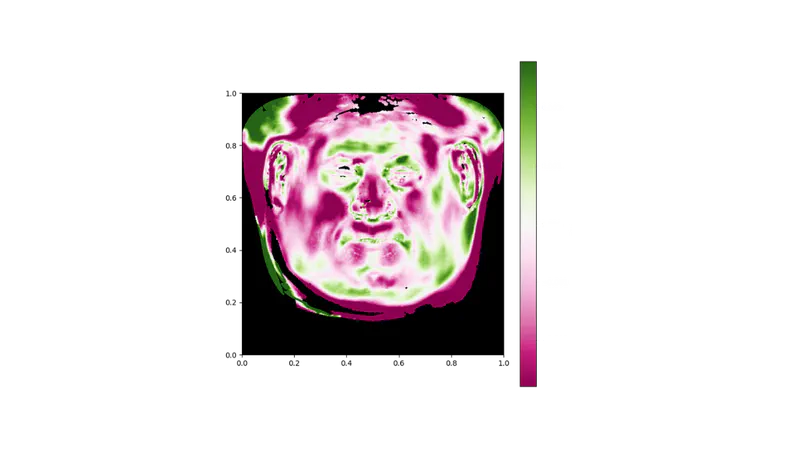
To make these geometric differences interpretable, we project the computed distances into UV space, resulting in a dense 2D texture map where each pixel encodes the signed error at a specific location on the face. Finally, we apply this texture directly onto the avatar’s 3D surface, creating a spatially coherent heatmap of geometric error (Fig. 3). This 3D visual overlay makes even subtle inaccuracies immediately visible, providing a powerful and intuitive diagnostic tool for analyzing avatar quality.
To assess the overall performance of our technology, we conducted a study involving 50 individuals who underwent both the capture studio and phone recording processes. Following the data collection, we performed statistical analyses to evaluate the average performance of our system and to identify any recurring areas of error. This helped us pinpoint consistent weaknesses in the process and refine the technology further. The results of these statistical analyses are shown in the figure below.
📊 In 90% of cases, face error is under 6mm — dropping to 3mm in half of all cases.
- Face region (actively scanned):
- 90% within max error of 6mm
- 50% within max error of 3mm
- Back of head (not captured by the app, reconstructed):
- 90% within 10mm
- 50% within 5mm
These results highlight the robustness of our reconstruction pipeline in the regions it actively captures, confirming that the performance in the recorded areas is not only reliable but also highly precise.
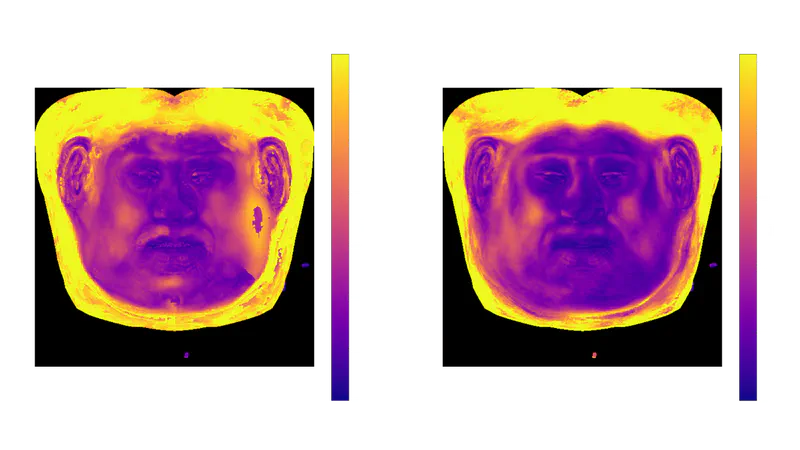
For a clearer visualization of the error distribution, we projected the measured distances onto a standardized 3D head model. These illustrations effectively reflect the findings discussed above. In the visualizations:
- Blue or purple: very low error (0–1 mm)
- Pink: low error (1–3 mm)
- Orange: moderate error (3–4 mm)
- Yellow: highest errors (4–5 mm)
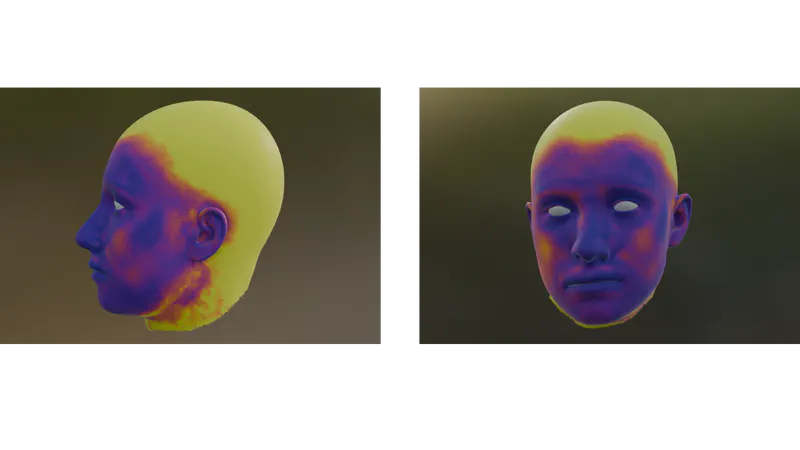
🎯 Most facial areas are within 1mm error range — visually imperceptible in real-world applications.
As seen in the visualizations, much of the facial region falls within the blue and purple range, demonstrating high accuracy. Only small details extend into the orange zone, which remains well within acceptable limits. Even in regions where the error map reaches yellow, this is only high relative to the exceptionally low errors seen elsewhere. An error of 4–5 mm is still quite small in absolute terms and would be imperceptible in most real-world applications. Notably, these higher-error regions correspond to parts of the head that are not recorded by the app, such as the back of the head. This reinforces the precision of our reconstruction, particularly in the most visually and functionally important areas.
Conclusion
The avatar geometry validation tool represents a significant advancement in ensuring the accuracy and realism of avatar scanning technology. By combining qualitative and quantitative evaluation methods, we have created a reliable framework for measuring geometric accuracy with unprecedented precision. This tool not only enables us to rigorously assess the performance of our technology but also empowers us to continuously refine and improve the scanning process.
Our approach has proven to be the most accurate scanning solution for end users, delivering high-fidelity avatars that accurately represent real human geometry. The study of 50 subjects has shown that our technology consistently achieves impressive accuracy, this tool’s capability to deliver measurable and interpretable quality metrics establishes a new benchmark for avatar scanning, unlocking a wealth of new opportunities. It enables us to foster confidence in technology, guaranteeing that digital humans are not just visually realistic, but also quantifiably precise. Furthermore, it paves the way for applications where exact accuracy is paramount, such as medical simulations, virtual try-ons, and other fields requiring high fidelity. This advancement not only sets a new standard in avatar accuracy but also opens the door for future innovations, ensuring that digital human representation continues to evolve with precision and reliability.